-
Products
- Gas analysis systems
- GAOS SENSON gas analyzers
- GAOS MS process mass spectrometry
- MaOS HiSpec ion mobility spectrometer
- MaOS AxiSpec ion mobility spectrometer
- Applications
- News
- Events
- About us

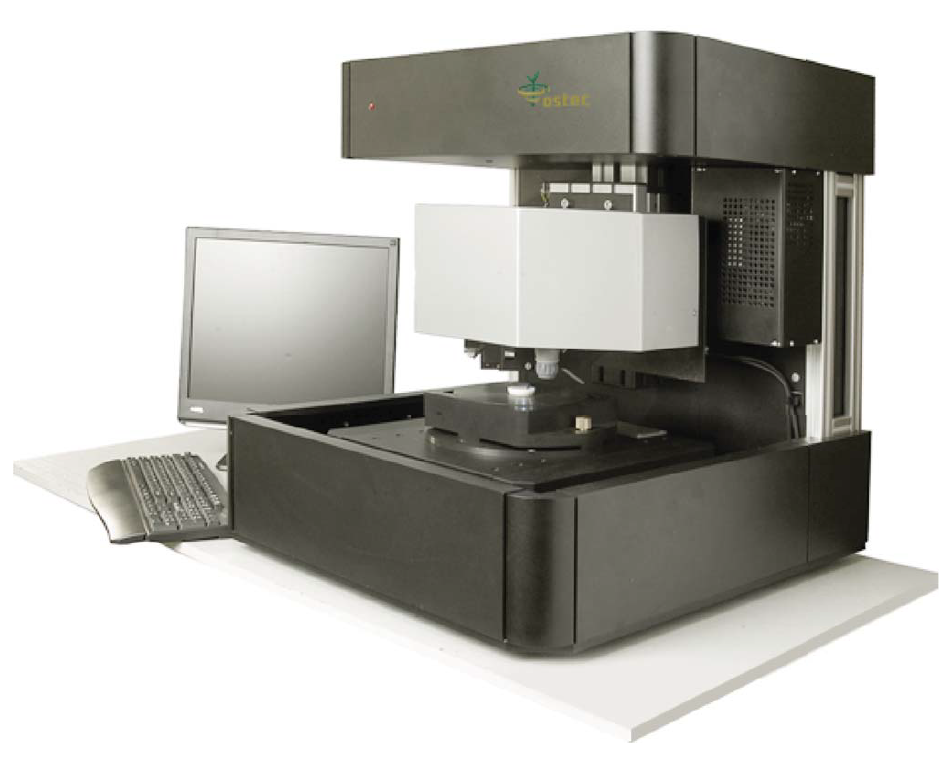
XROS MF30 – laboratory x-ray microscope-microprobe for studies of the objects by the methods of the optical microscopy, radiography, local element XRF microanalysis with possibility of the element mapping.
Using a microscope, a sample of up to 400 mm in size along the Y axis and of unlimited size along the X axis (max. scan area 150×150 mm; in the case of a larger area, the scanned areas can be stitched) and up to 105 mm high can be performed.
An overview video camera and two optical microscopes with magnification up to 200 times are using for accurate determination of the scanning area.
The central optical microscope with automated sharpness adjustment is combined with the axis of the microprobe (axis of the x-ray beam).
Local X-ray fluorescence microanalysis with the possibility of elemental mapping and X-ray studies can be carried out both separately and simultaneously.
The sample positioning accuracy is 10 microns.
The minimum diameter of the x-ray probe is 30 µm.
The range of simultaneously measured elements from 11Na to 92U.
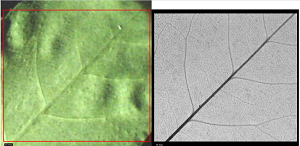
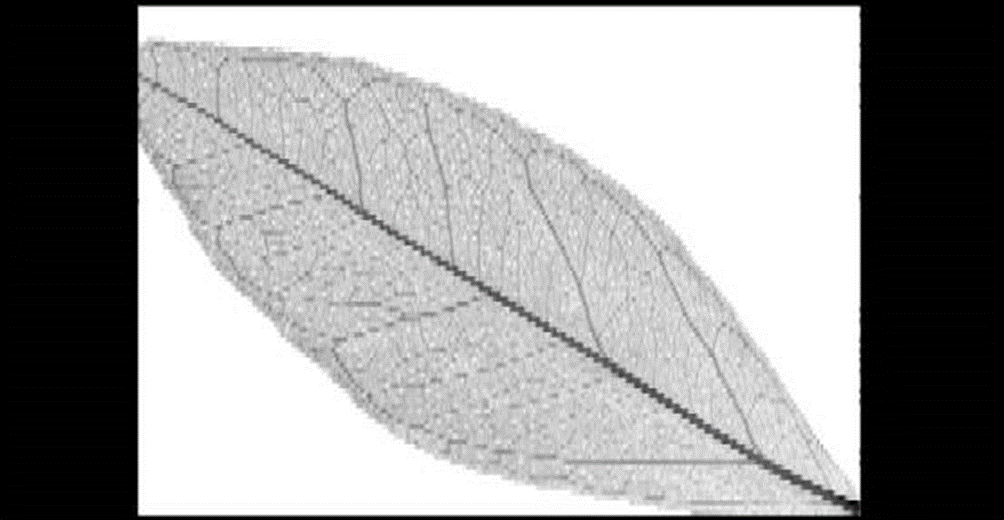
Samples: dried leaves growing near the fruits of the mandarin.

Figure 1. The first sample


Figure 2. The total spectrum of the 1st sample

|

|

|

|

|

|
The main elements present in the leaves are potassium and calcium. Calcium, like strontium, is distributed mainly in the stem. Potassium, as well as chlorine and zinc, are distributed in stem and stipules (paired appendages on both sides of the basal sheath). However, chlorine is less concentrated than potassium. The minor concentration of iron and manganese can also be observed there. These contaminant elements are located on the surface of the lamina. Shining inclusions can be observed on the surface of the sheet, which is probably caused by manganese contamination.

In the second leaf, there are much more copper and bromine. Nickel and barium are also present.

Figure 3. The second sample


Figure 4. Total spectrum of the 2nd sample
Chlorine is distributed near the stem (similar to the first leaf). Potassium and calcium are nonuniformly distributed, which may be associated with disease (brown spots are observed on the leaf).

|

|

|

|

|

|

|

|
 |
 |
 |
 |
 |
|
| Scan step | 500 µm |
| Scan rate |
500 µm/s |
| Measurement time |
500 ms |
| Voltage |
40 kV |
| Electric current |
5000 µA |
| XRT | Mo anode |
| Atmosphere |
Air |