Experimental unit
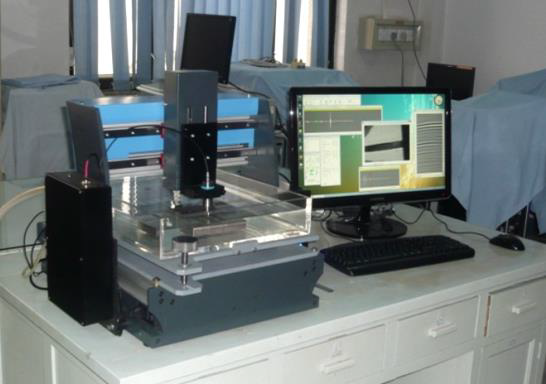
Scanning Impulse Acoustic Microscope (SIАМ), Institute of Biochemical Physics, RAS, 2011
|
Modes:
|
|
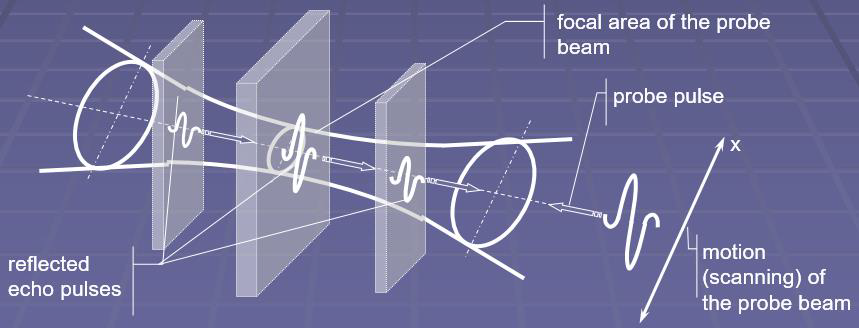
Principles of acoustical bulk imaging
- Reflection mode;
- Impulse probe signals;
- Time resolution of echo signals coming from different depth inside the specimen bulk
- 1D or 2D probe beam scanning for image formation
Basic modes of data representation
 Probe pulse
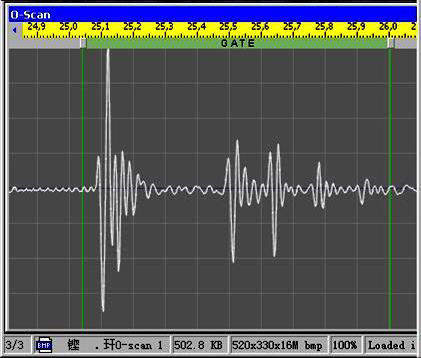
Electronic gate (given by green color) – the technique of signal processing for displaying recorded signals as acoustical B- and C-scans.
|
|
|
|
Echo pattern - oscillogram of the reflected signal
|
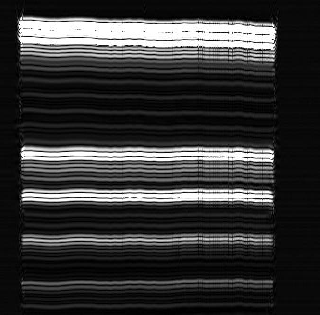
B-scan
the sweep of echo signal within the electronic gate when 1D motion of the acoustic lens
|
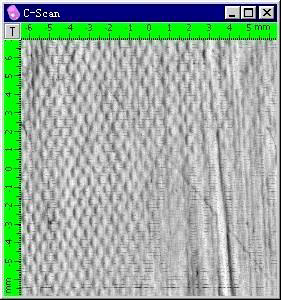
С-scan
gray-scale displaying of echo-signal amplitude variations within the electronic gate in 2D scanning of the acoustic lens
|
Idea of nanocomposites
- routine polymer medium as a binder (matrix material)
- nanosized particles as filler
- small content of nanofiller (usually 0.05 ¸ 10 weight %)
- uniform distribution of nanofiller over the matrix material
Advantage of nanocomposite materials – new physical properties:
- DC electrical conductivity
- HF electromagnetic properties - effective EM absorption, resonance phenomena, shielding, screening, etc.
- high heat conductivity
- mechanical properties enhancing elastic moduli and strength
Graphite – Epoxy Nanocomposites
Binder: epoxy resin Epicote Resin 828 produced from Bisphenol A and Epichlorohydrin with a curing agent A1 (modified TEPA)
Nanofiller: diverse kinds of graphite nanoparticles
- Exfoliated graphite (EG). Milled exfoliated graphite, particle sizes – (20 ÷ 500) μm
- Flat micronic graphite (FMG). Fine milling and thermal treating of exfoliated graphite. Graphite stacks consisting of 30- 40 graphite atomic layers. Lateral sizes are not larger than 10-15 μm
- Graphite nano-platelets (GNP). Intercalation / Pulverization / Additional milling Thickness ~10 nm, lateral sizes ~1 - 10 μm
- Multiwall carbon nanotubes (MWCNT). CVD produced carbon multiwall nanotubes, Ø 20 – 40 nm, 5 - 12 μm long
Possible mechanisms of properties enhancement
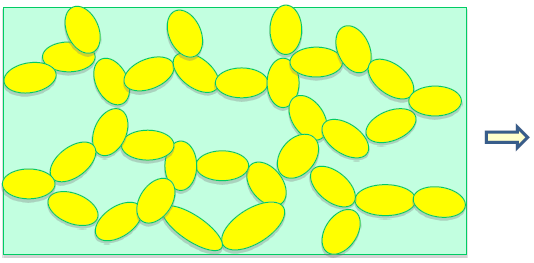
1. Formation of fractal clusters of contacting nanoparticles in polymer matrix: formation of conductive nets and islands
|
electrical and heat conductivity;
electromagnetic properties
|
2.Restructuring polymeric matrix by the ordering of macromolecules in the vicinity carbon nanoparticles

|
elastic and strength properties
|
The paper goals
Application of the high-resolution acoustic vision technique for studying fundamental problems of nanocomposite material science:
- uniformity of nanoparticle distribution over the composite bulk for nanocomposite with different types of carbon nanofiller;
- what elastic properties– enhanced or worsened ones comparing with properties of the neat polymer binding; are realized in nanocomposites with different carbon nanofiller;
Applied method: Scanning Impulse Acoustic Microscopy
Investigated materials: Epoxy + different carbon nanoforms
Mechanisms of acoustical contrast in carbon nanocomposites
1. Acoustical imaging in epoxy + exfoliated graphite (EG) composites
Reflection or scattering of the probe beam at EG particles.
Tops of EG particles only are displayed in acoustical images.
Radiation reflected from other parts of the particle surface does not get into the aperture of the acoustic objective.
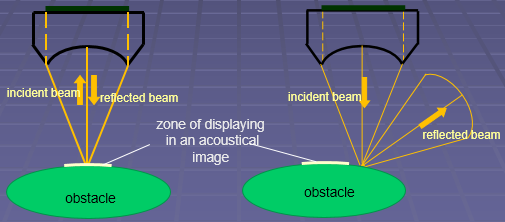
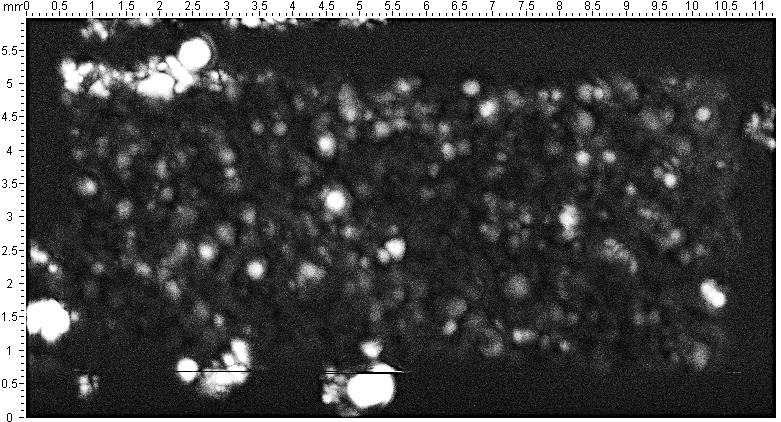
Acoustical images of epoxy + EG composites represent only the occurrence of EG particles and their position in the specimen bulk. They give no information on particle sizes and shapes.
2. Acoustical imaging in epoxy + 2D nanocarbon (FMG and GNP) composites
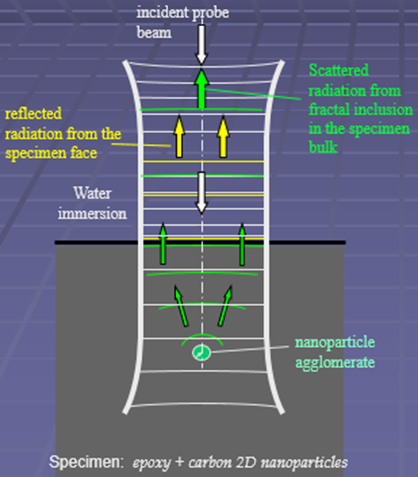
Scattering at micronic 2D nanoparticle agglomerates filled by air (aerogels).
|
1. 2D nanoparticles agglomerate into micron-sized conglomerates because of their high affinity to each other (higher than their affinity to polymer binder).
2. Trapping air in interparticle space and aerogel formation
3. Ultramicroscopic mode of imaging - receiving radiation scattered at small obstacles inside the focal zone of the probe beam.
4. High efficiency of ultrasonic scattering at small acoustically soft obstacles (scatterers filled by air)
|
The ultramicroscopic mode is the acoustical analog of the dark-field technique in optics
Acoustical images depict the presence
and position of scatterers, not their sizes, and shapes.
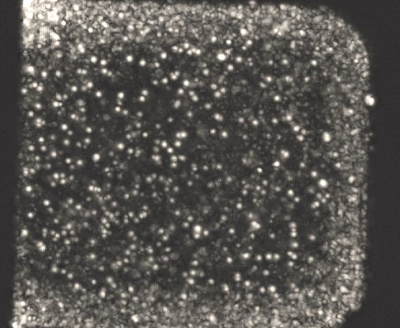
What minimal objects could be seen with impulse acoustic microscope in the specimen bulk?
|
|
It is seen in the acoustic image:
|
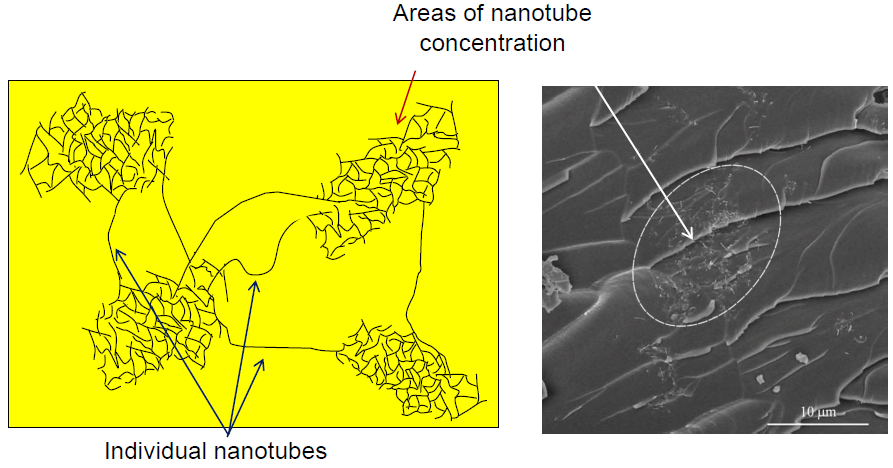
3. Acoustical imaging in composites with carbon nanotubes (epoxy + MWCNT)
Acoustic contrast as a result of the non-uniform distribution of nanotubes and corresponding spatial variations of local elasticity.
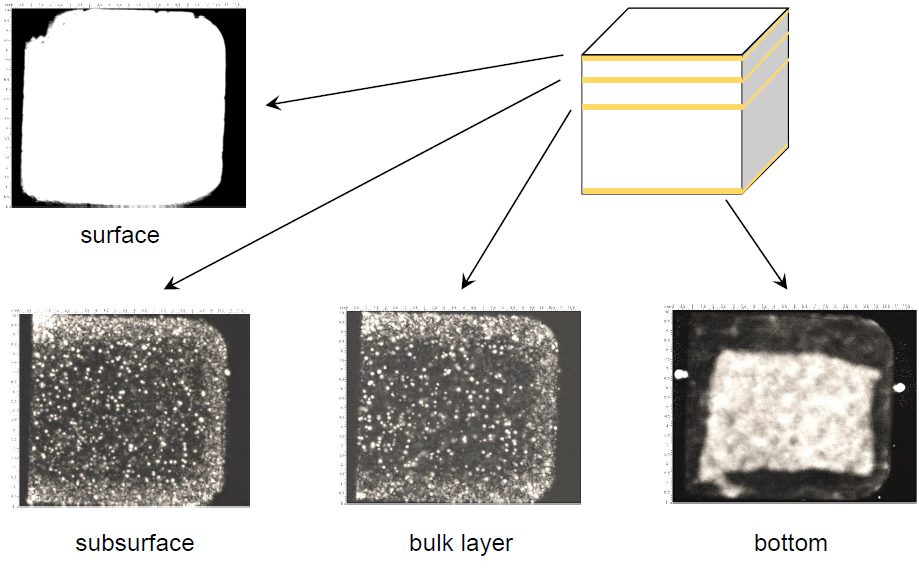
3D imaging of carbon nanocomposites. Bulk microstructure
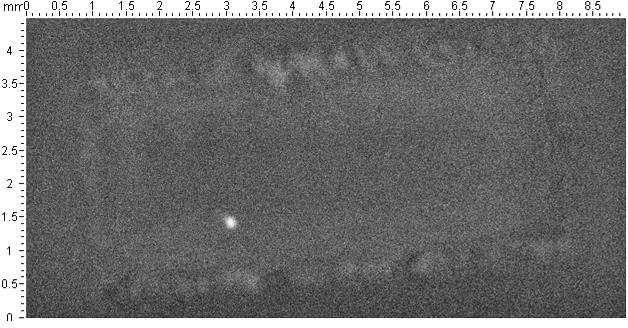
Interior structure in the pristine epoxy resin
|
Specimen thickness d = 1.74 mm
Operation frequency - 50 MHz
|
Acoustic image (C-scan) of interior structure in the middle of the specimen thickness
Imaging layer 120 μm thick is inside the specimen at the depth of 400 μm.
|

|
Specimen thickness d = 400 μm
Operation frequency - 100 MHz
|
Acoustic image of the specimen bulk structure in a transverse section (B-scan)
Bulk microstructure of the (epoxy + 1.5 w% EG) specimen
|
Specimen thickness d = 1.35 mm
Operation frequency - 50 MHz
|
Acoustic image (C-scan) of interior structure in the middle of the specimen thickness
Imaging layer 200 μm thick is inside the specimen at the depth of 405 μm.
|

|
Specimen thickness d = 420 μm
Operation frequency - 100 MHz
|
Acoustic image of the specimen bulk structure in a transverse section (B-scan)
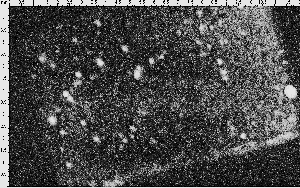
Bulk microstructure of the (epoxy + 1.5 w% FMG) specimen
|
Specimen thickness d = 1.42 mm
Operation frequency - 50 MHz
|
Acoustic image (C-scan) of interior structure in the middle of the specimen thickness
Imaging layer 120 μm thick is inside the specimen at the depth of 310 μm.
|

|
Specimen thickness d = 430 μm
Operation frequency - 100 MHz
|
Acoustic image of the specimen bulk structure in a transverse section (B-scan)
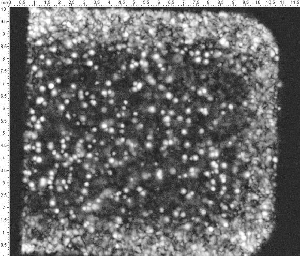
Bulk microstructure of the (epoxy + 0.75 w% GNP) specimen
|
Specimen thickness d = 1.56 mm
Operation frequency - 50 MHz
|
Acoustic image (C-scan) of interior structure in the middle of the specimen thickness
Imaging layer 130 μm thick is inside the specimen at the depth of 400 μm.
|

|
Specimen thickness d = 360 μm
Operation frequency - 100 MHz
|
Acoustic image of the specimen bulk structure in a transverse section (B-scan)
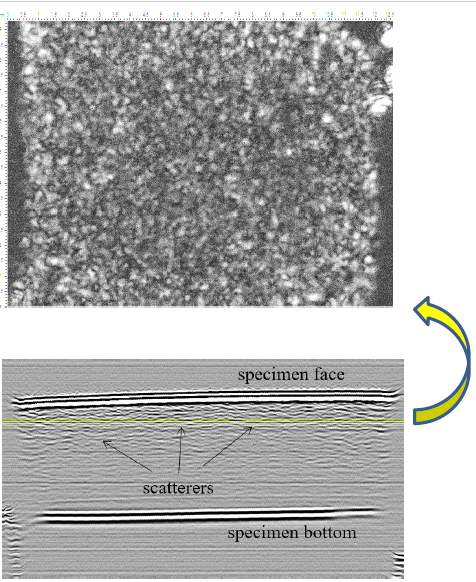
Bulk microstructure of the (epoxy + 0.1 w% MWCNT) specimen
|
Acoustic image (C-scan) of interior structure in the middle of the specimen depth.
Specimen thickness d = 1.39 mm
Operation frequency - 100 MHz
Imaging layer 60 μm thick is inside the specimen at the depth of 280 μm.
|
Imaging layer
Acoustic image of bulk microstructure in a transverse section (B-scan) of the same specimen
|
|
Material
|
Specimen thickness
d, mm
|
Longitudinal sound velocity
cL, km/sec
|
Transverse sound velocity
cT, km/sec
|
Density
ρ, g/cm3
|
|
Epoxy 100%
|
0.40
1.74
|
2.88
2.90
|
1.37
-
|
1.170
-
|
|
Epoxy+1 w % EG
|
0.36
1.58
|
3.00
2.86
|
1.40
-
|
1.186
-
|
|
Epoxy+1 w %GNP
|
0.43
0.93
|
2.99
3.05
|
1.41
-
|
1.182
-
|
|
Epoxy+1 w %TG
|
1.60
|
3.04
|
-
|
1.135
|
|
Epoxy+ 0,1 w % MWCNT
|
1.39
|
2.80
|
-
|
1.180
|
|
Average
|
|
2.99
|
1.99
|
1.171
|
Comparison of non-destructive techniques for 3D visualization of bulk microstructure in nanocomposites
Available techniques of bulk microstructure visualization:
- High-resolution X-ray tomography. Spatial resolution is given by the thickness of the X-ray probe beam. Micron-scale resolution is implemented by synchrotron radiation or application of special high-power X-ray tubes.
- Impulse scanning acoustic microscopy. Spatial resolution is given by the wavelength (15 – 60 μm) of the probe ultrasound. Ultramicroscopic mode provides micron resolution of 3D imaging of the bulk microstructure.
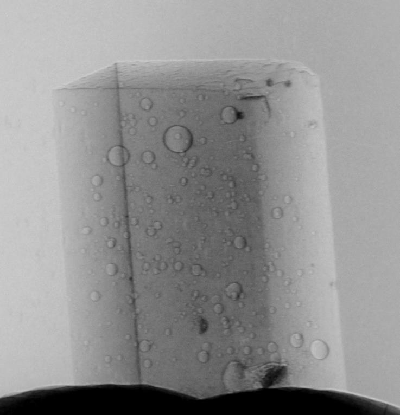
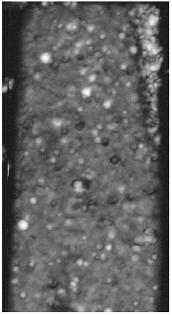
Bulk microstructure of the (epoxy + 1.5 w% exfoliated graphite) specimen (thickness d = 1.44 mm)
synchrotron radiation;
probe beam Ø 20 μm
|
focused ultrasound,
f = 50 MHz, λ = 30 μm
|
|
|
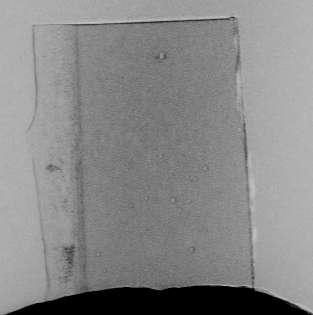
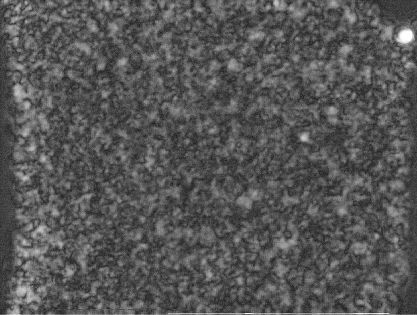
Bulk microstructure of the (epoxy + 0.1 w% MWCNT) specimen (thickness d = 1.4 mm)
synchrotron radiation;
probe beam Ø 20 μm
|
focused ultrasound,
f = 50 MHz, λ = 30 μm
|
|
|
Conclusions
-
It was shown the impulse acoustic microscopy is a powerful technique for studying the internal microstructure and local elastic measuring in the bulk of nanocomposite materials.
-
It was the first time when the occurrence of complicated fractal mesostructure in the bulk of nanocomposites has been shown.
-
Efficient agglomeration of carbon nanofiller in the bulk of carbon nanocomposites has been demonstrated for 2D carbon nanoforms.
-
Local elastic measurements demonstrated sufficient elastic homogeneity of carbon nanocomposites despite occurrence of bulk mesostructure.
Ultrasonic elastic measurements demonstrate minimal influence of nanofiller on elasticity of carbon nanocomposites for wide spectrum of carbon nanoforms being used as nanofiller – from exfoliated graphite up to carbon nanotubes and thick grapheme stacks.


